Analytics
Vish Analytics is where you can gain those insights to better understand your color business.
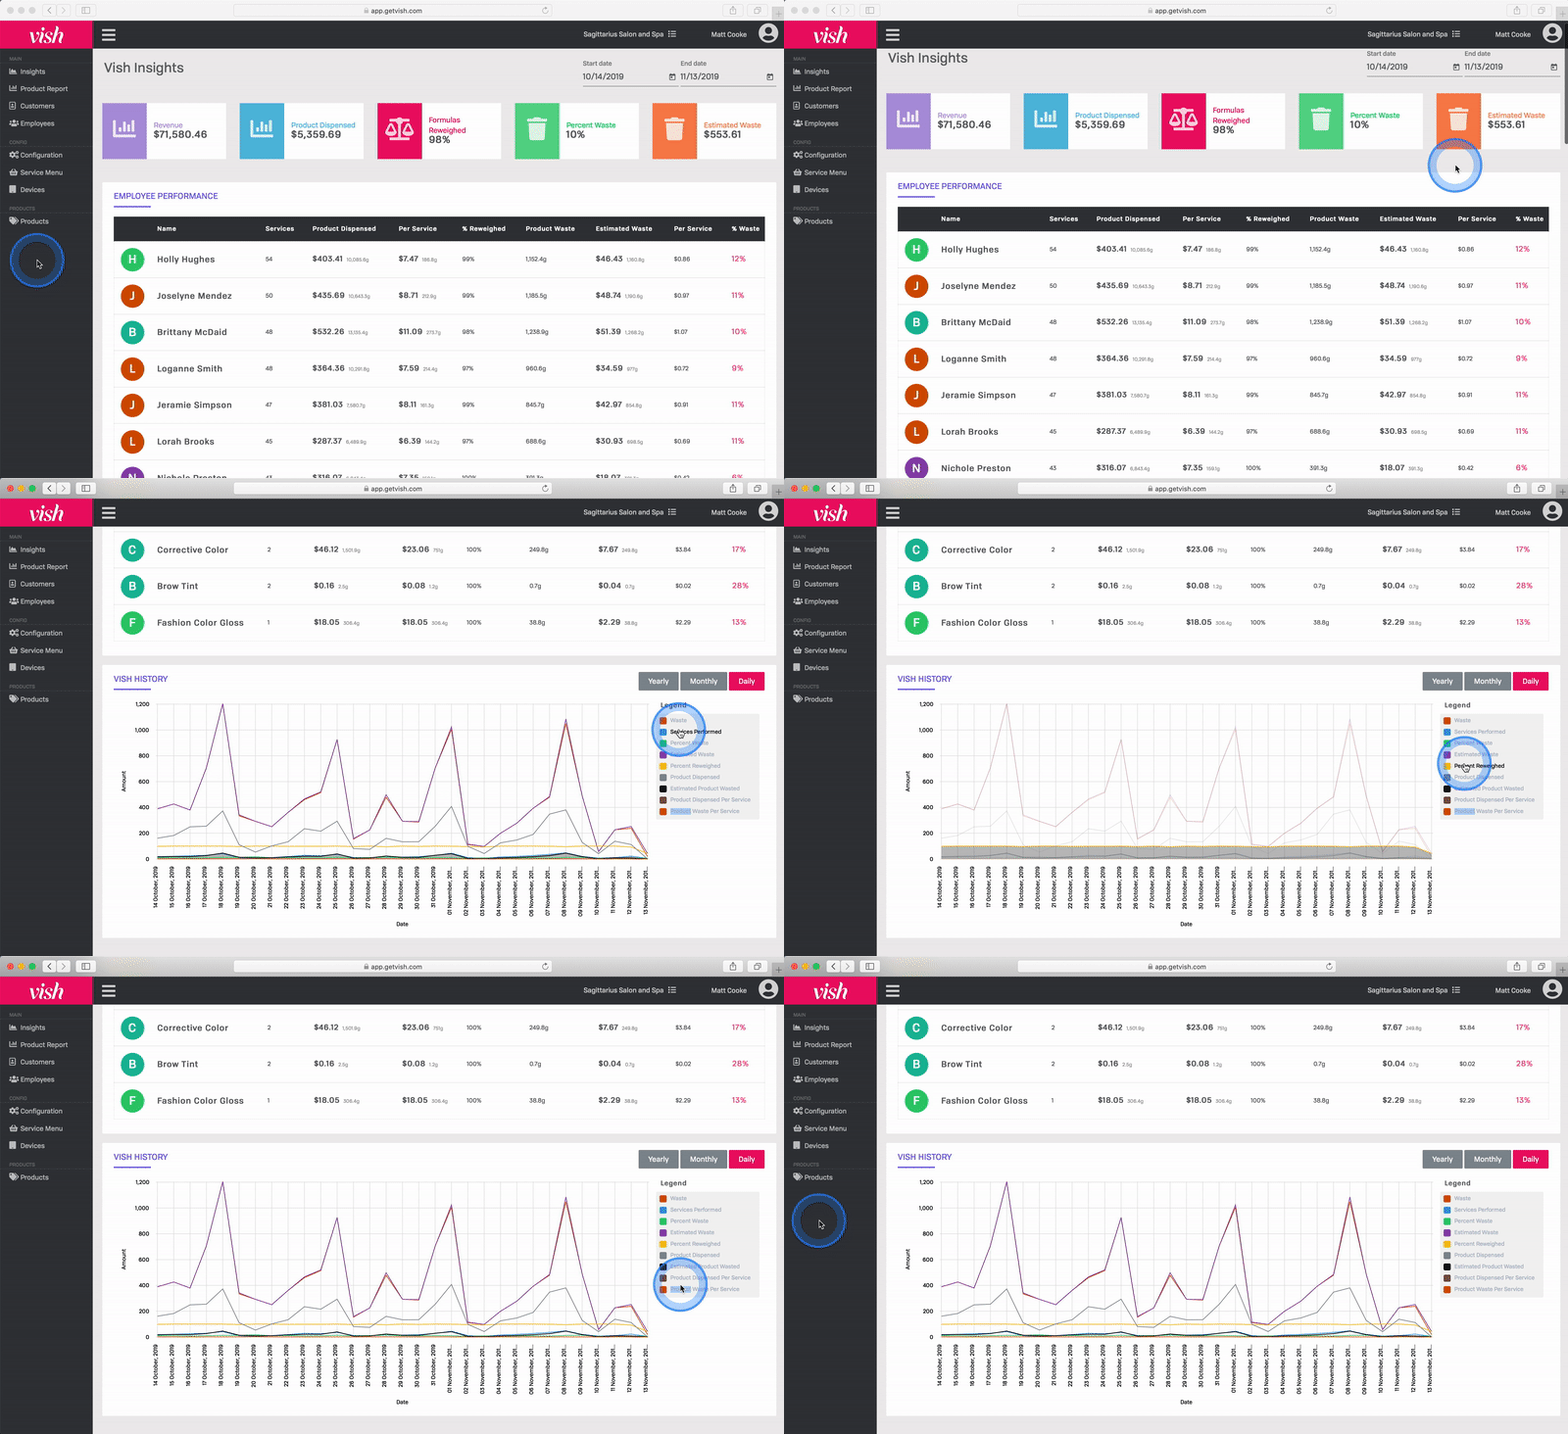
Vish analytics are broken down into five key metrics:
- Revenue the total generated revenue from all services performed
- Product Dispensed the total wholesale cost of all product dispensed
- Percent Reweighed percentage of formulas that have been reweighed
- Percent Waste percentage of dispensed product that has been wasted
- Estimated Waste because we understand that not all formulas are reweighed, Vish estimates how much product is actually being wasted based on the actual measured waste and reweigh percentage
The data from the last 30 days is displayed by default, however, you can change the date range in the date picker in the top right corner.
Employee Performance Report
The employee performance table contains Vish metrics for each individual employee. This information is valuable to gain insight into which employees are performing well (i.e. low waste percentage), and who may need further training.
The table is sorted by number of services performed, so the most active employees will be found at the top.
Service Report
The service report table contains Vish metrics for each individual service. This information is important to gain insight into which services are performing well (i.e low estimated waste).
The table is sorted by number of services performed, so the most active services will be found at the top.
Waste History
The waste history graph is a great way to visualize your salons key metrics over time.
You may click to toggle the following metrics from the legend:
- Waste
- Services Performed
- Percent Waste
- Estimated Waste
- Percent Reweighed
- Product Dispensed ($)
- Estimated Product Wasted
- Product Dispensed per Service
- Product Waste Per Service
